Consecutive Contests Reshape NBA Lines Through Documented Fatigue Effects
Devon Vogel · Aug 23, 2026
Consecutive Contests Reshape NBA Lines Through Documented Fatigue Effects
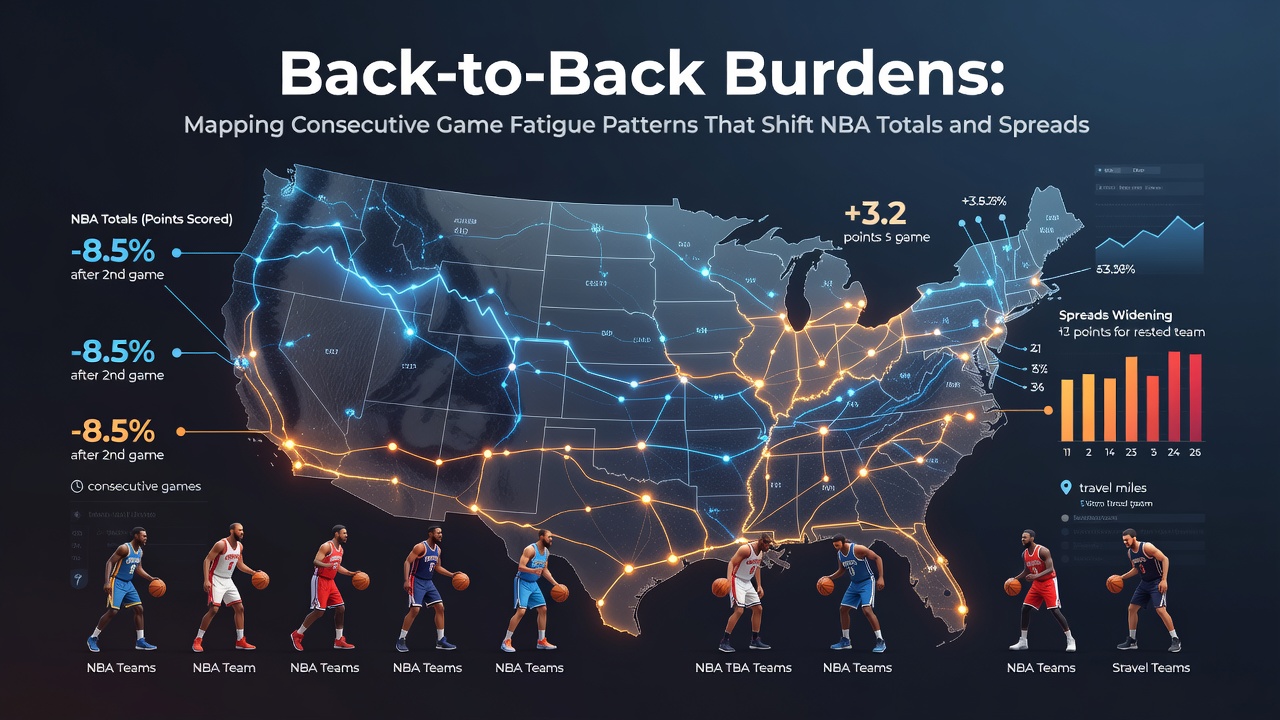
Back-to-back games create measurable drops in player efficiency that shift both point totals and spread results across the NBA schedule, with data from recent seasons confirming lower scoring averages and altered margins when teams face limited recovery windows. Researchers tracking rest patterns have compiled extensive records showing how consecutive contests compress preparation time and elevate physical demands, producing consistent statistical deviations from season-long norms.
Scheduling Patterns and Rest Allocation
NBA teams encounter back-to-back sets multiple times each season because the league calendar packs 82 games into roughly six months, forcing clusters that reduce average rest between games to under 24 hours for affected squads. Data compiled by league tracking systems reveals that road back-to-backs compound these effects since travel adds further strain, whereas home instances still register performance declines but at slightly moderated rates. Observers note that August schedule releases each year, including the one previewed for 2026, continue to distribute these pairings across conferences, with certain clubs facing eight or more such sequences based on geographic clustering.
Performance Metrics Under Fatigue
Studies from sports science institutions document that shooting percentages, assist rates, and defensive rebounding all decline when players log minutes on zero days of rest, with field goal accuracy dropping by margins that range from three to six percentage points in aggregated samples. Those who've examined box scores across multiple seasons find that pace often slows as well because transition opportunities decrease when legs tire, which in turn compresses total points produced. Turnovers rise modestly while free throw attempts sometimes increase due to fatigue-induced fouls, yet the net result on scoring remains downward in the majority of tracked instances.
Effects on Betting Totals
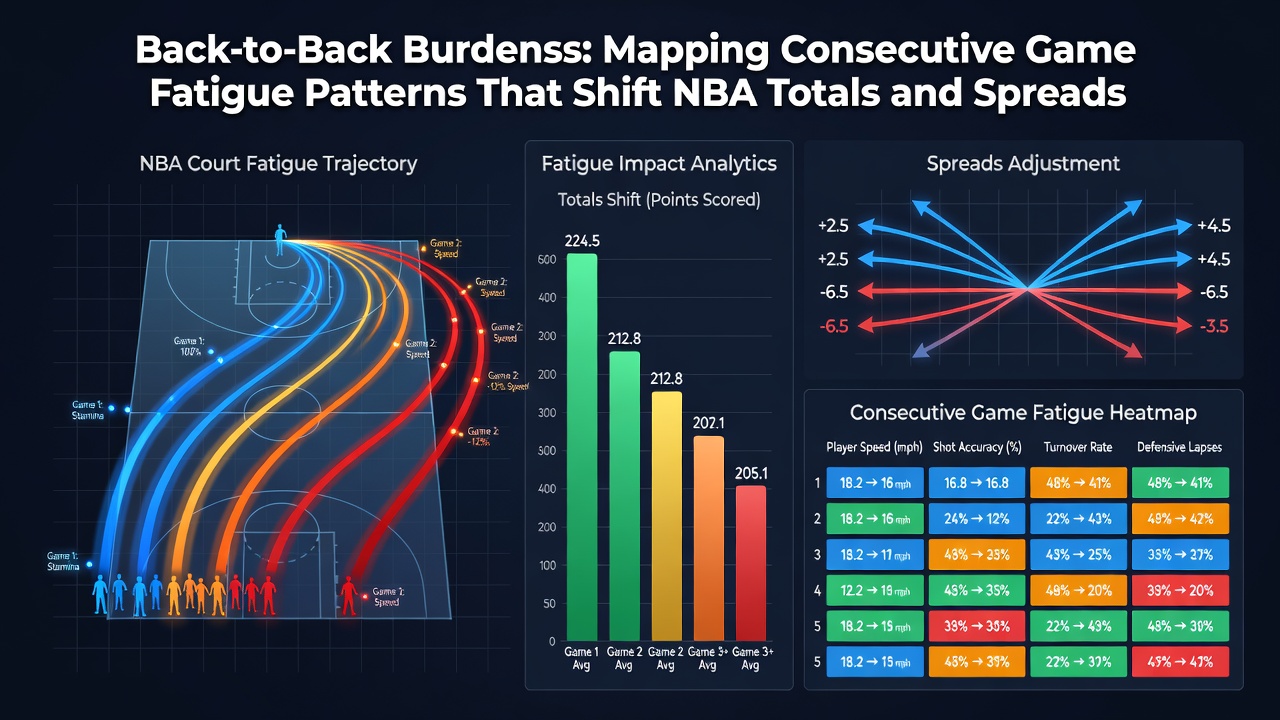
Lower outputs translate directly into totals markets where unders have covered at elevated rates in back-to-back scenarios, according to historical play-by-play archives maintained by analytics platforms. When both teams arrive on short rest the combined scoring average falls further, sometimes by double-digit margins compared with standard rest games, prompting line makers to adjust closing totals downward in advance. One dataset covering the 2024-2025 campaign showed unders hitting in 58 percent of games involving at least one back-to-back participant, a figure that climbed when both clubs operated under the same constraint.
Spread Movement and Rest Disparities
Spread outcomes also reflect these imbalances because rested opponents exploit diminished defensive rotations and slower closeouts, widening margins in games where one side holds a rest advantage. Research from university athletic performance labs indicates that home teams on normal rest cover spreads more frequently against visitors arriving after consecutive road contests, with the differential reaching statistical significance in conference play. Line movement data further shows that oddsmakers initially post numbers that underweight these factors early in the season before public betting and sharp action force adjustments as patterns repeat.
Player-Level Data and Position Variations
Position-specific tracking reveals that perimeter players experience sharper drops in three-point volume and efficiency on back-to-backs, while bigs register reduced block and steal numbers because vertical explosiveness wanes. Minutes restrictions implemented by coaching staffs on the second night further alter rotations, concentrating production among a smaller group that accumulates higher usage yet still posts lower per-minute outputs. Aggregated player tracking from optical systems confirms these shifts across star and role-player cohorts alike, supplying granular inputs that betting models incorporate when projecting individual and team contributions.
Seasonal Trends Entering 2026
As August 2026 approaches and teams finalize preparations for the upcoming campaign, schedule analysts continue to map back-to-back density across divisions because early-season examples often set the tone for how lines respond later. Data from prior years demonstrates that the effect persists through playoffs when rest advantages become even more pronounced due to shorter series formats, although regular-season volume provides the largest sample for pattern confirmation. External sources such as peer-reviewed examinations of athlete recovery and comprehensive records housed at Basketball Reference supply the underlying numbers that support these observations without relying on single-season anomalies.
Conclusion
Consecutive game scheduling produces verifiable fatigue signatures that reshape both totals and spreads through documented reductions in efficiency and pace, with multi-year datasets confirming the directional consistency of these shifts. Teams, analysts, and line makers incorporate these rest-based variables into projections because the patterns repeat across conferences and seasons, delivering measurable edges when models weight recent rest disparities accurately. Continued refinement of tracking technology promises even finer resolution on how individual workloads compound these effects going forward.