Fatigue Across Fields: Workload Data Guiding Accumulator Bets in Soccer and Basketball Leagues
Freya Schwarz · Jun 2, 2026
Fatigue Across Fields: Workload Data Guiding Accumulator Bets in Soccer and Basketball Leagues
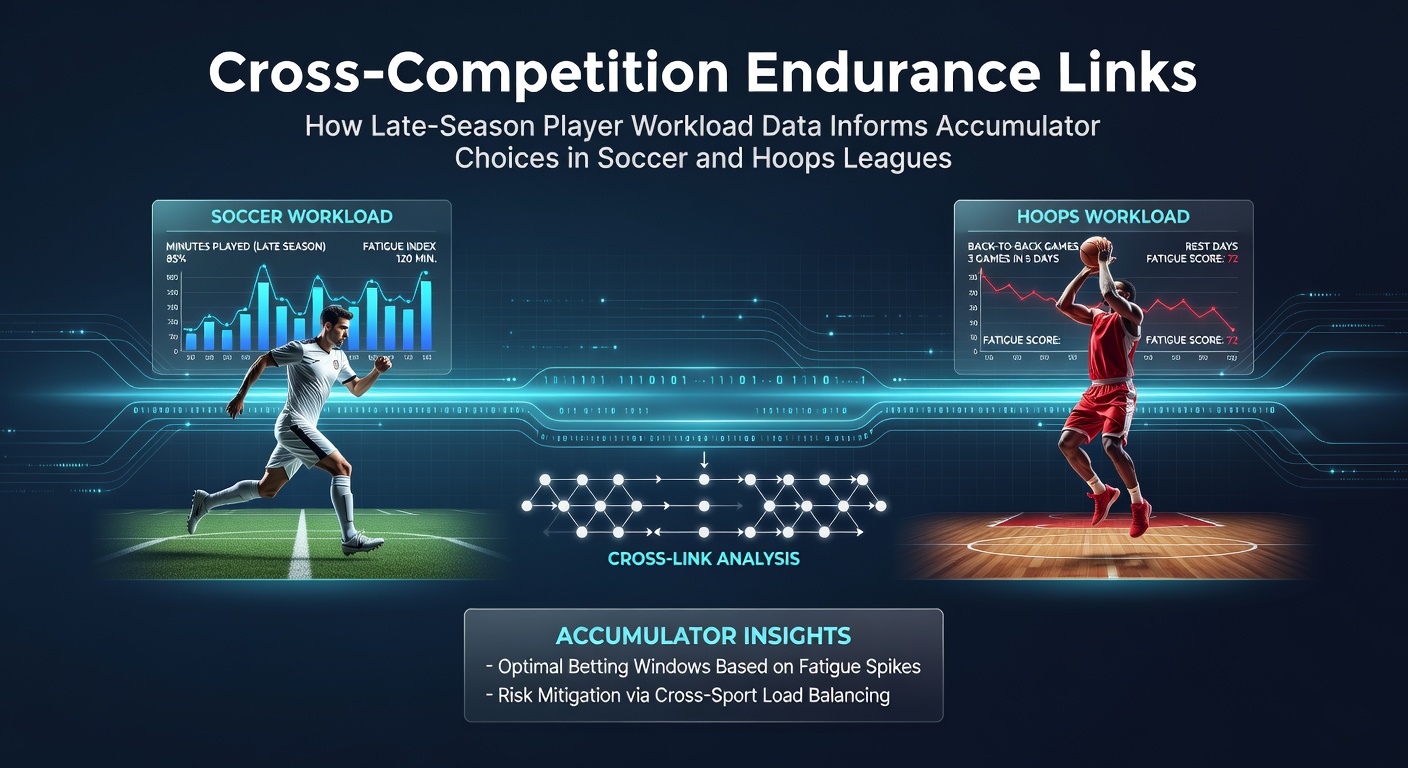
Late-season fixtures in soccer and basketball often hinge on player endurance levels that shift dramatically once teams push past 30 matches or more and data from wearable devices starts revealing clear patterns in recovery times and minutes logged. Observers note that these metrics carry direct weight when bettors build accumulators because squads with overloaded rosters tend to underperform in specific markets like total goals or points spreads once fatigue compounds across back-to-back weeks.
Tracking the Numbers Behind Endurance
Researchers track total distance covered, high-intensity sprints and heart-rate recovery through GPS and optical systems while leagues collect these figures to flag players who exceed 300 minutes in a 14-day window. In soccer, data from domestic campaigns shows that midfielders averaging above 12 kilometers per game in April and May post lower pass-completion rates in subsequent fixtures and similar thresholds appear in basketball where guards logging 38-plus minutes per contest see three-point percentages dip after consecutive heavy workloads. These indicators help shape accumulator selections by highlighting sides likely to rest key contributors or manage rotations more conservatively in the final stretch.
Cross-League Connections in June 2026
June 2026 brings overlapping recovery periods for European soccer clubs and NBA franchises heading into international windows or off-season preparation and workload spikes from May carry forward because players rarely reset completely between seasons. Studies from sports-science groups indicate that athletes crossing between club and national-team duties accumulate 15 to 20 percent more load than peers who stay domestic-only and this overlap influences betting lines on early-summer friendlies or exhibition games. Bettors who cross-reference soccer fixture congestion with basketball playoff minutes often adjust accumulator legs on player props or team totals because shared fatigue trends emerge across both sports when rest protocols tighten.
One study revealed that European soccer teams advancing deep into cup competitions while maintaining league schedules posted a 22 percent drop in expected goals during the subsequent three matches once cumulative load crossed 450 minutes for starting elevens. Basketball analysts observe parallel drops in effective field-goal percentage for teams whose rotation players exceed 36 minutes across four games in five nights and these patterns feed directly into accumulator construction because markets adjust slower than the underlying data.
Building Accumulators Around Load Data
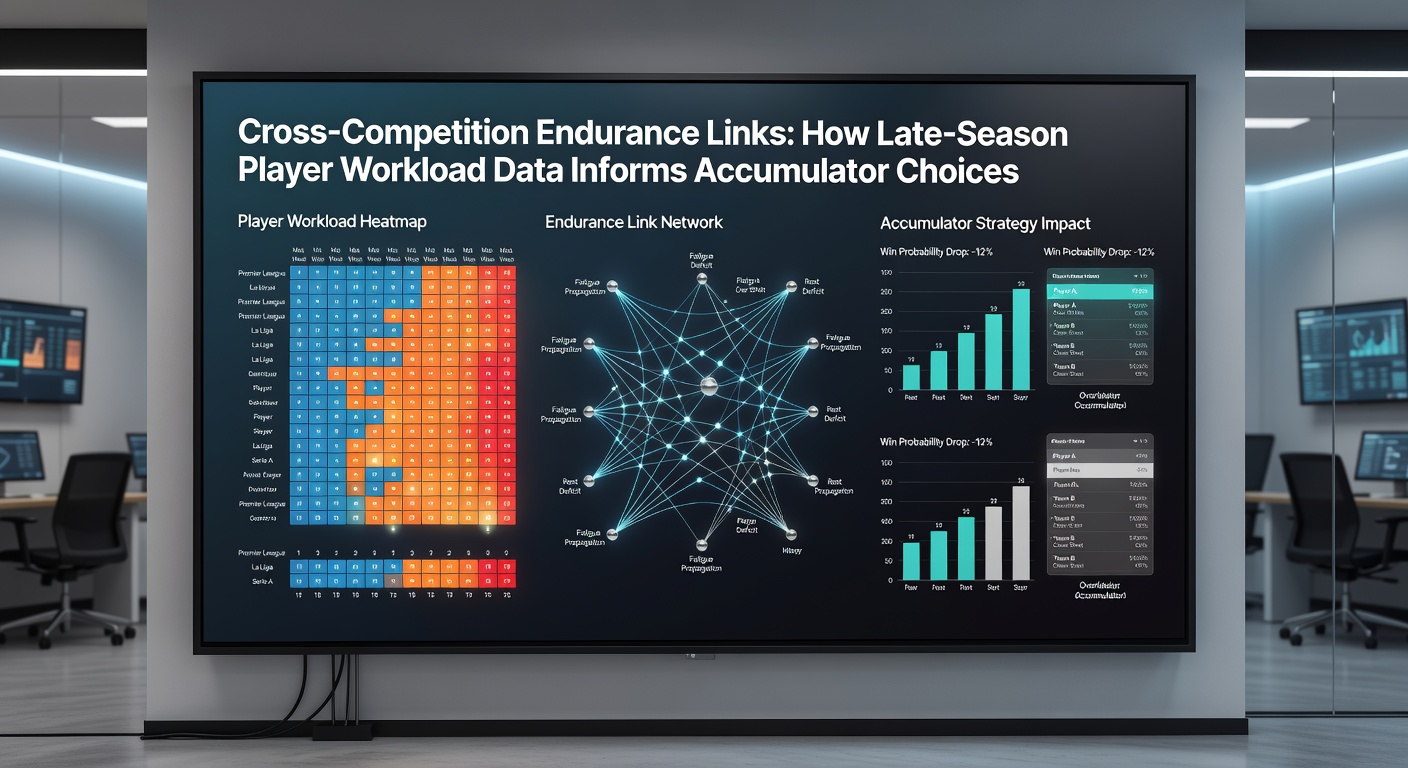
Accumulator builders examine rolling seven-day and 14-day workload reports to select legs such as under total goals in soccer matches involving sides with multiple players above threshold minutes or under total points in basketball games featuring back-to-back road teams. Figures from league tracking services show that soccer clubs resting two or more starters after heavy prior weeks cover under-2.5-goal lines at higher rates while NBA squads managing minutes for star players hit under-total-points markets more consistently in the final month. Those who monitor both sports simultaneously create multi-leg bets that pair a soccer under with a basketball under because cross-competition fatigue trends reinforce each other when calendars compress.
Regional Examples and Patterns
Take one dataset from North American basketball conferences where teams playing five games in eight days recorded a 9 percent decline in defensive rating and compare that to UEFA league matches where squads with similar congestion showed elevated yellow-card counts. External analysis from NBA tracking databases and parallel European reports illustrates how these dips translate into reliable accumulator components once bettors isolate the affected fixtures. Another source at FIFPRO workload studies highlights comparable recovery curves for soccer players returning from international duty in early June and these curves align closely with basketball playoff recovery timelines.
Practical Data Integration for Bettors
Teams release load-management announcements through official channels and these statements correlate strongly with statistical thresholds that have already appeared in prior seasons. Observers who combine public injury reports with private workload metrics often narrow accumulator selections to matches where multiple indicators point in the same direction such as reduced high-speed running in soccer or lowered sprint volume in basketball. The result is a tighter focus on outcomes that reflect actual player availability rather than headline form alone and this approach keeps accumulator structures grounded in measurable endurance trends across both sports.
Conclusion
Late-season workload figures in soccer and basketball supply consistent signals that shape accumulator construction once bettors align recovery data with fixture lists and the patterns hold across regions and competition types. June 2026 simply extends the same monitoring cycle because overlapping schedules amplify the effects already visible in prior campaigns.