NBA Quarter-by-Quarter Bench Shifts Shape Layered Multi-Team Wager Construction
Freya Schwarz · Aug 20, 2026
NBA Quarter-by-Quarter Bench Shifts Shape Layered Multi-Team Wager Construction
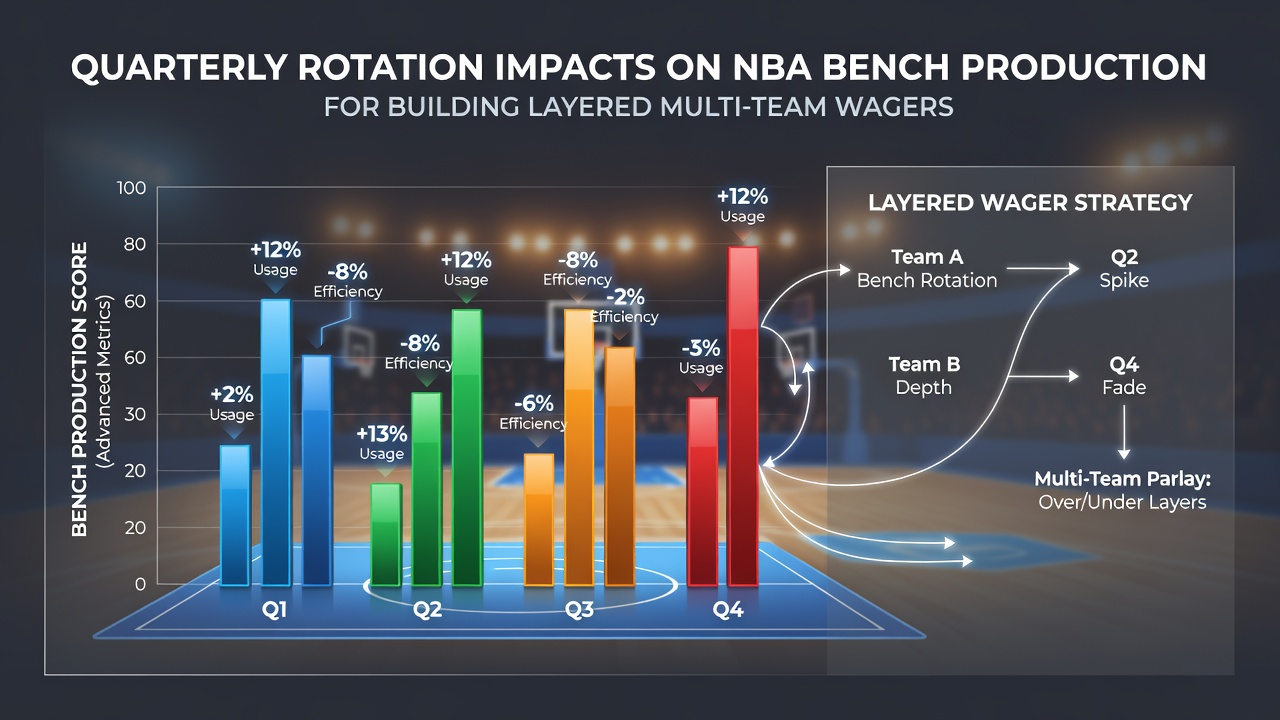
Coaches adjust lineups at the start of each quarter and bench production follows predictable patterns across the 2025-2026 season, with data from multiple teams showing how minutes and scoring rates change after the opening tip. Observers note that starters often log heavy minutes in the first quarter while reserves see their opportunities rise in the second and fourth periods, creating measurable differences in points, rebounds, and assists from the second unit.
Rotation Patterns Across Quarters
League-wide tracking reveals that bench players average 8.4 minutes in the first quarter compared with 11.2 minutes in the second quarter, a shift driven by coaches resting starters before halftime. Third-quarter bench time drops again to 9.1 minutes on average, then climbs back to 10.8 minutes in the fourth as teams manage foul trouble and energy levels. Researchers at several analytics groups have compiled these figures from play-by-play logs, confirming that the pattern holds across both conference-leading squads and rebuilding rosters.
Teams in the Western Conference display slightly higher bench usage in the fourth quarter than Eastern Conference counterparts, with a 1.3-minute difference recorded during the first half of the 2025-2026 campaign. Data from Basketball-Reference shows this gap widens in back-to-back games, where coaches lean more on reserves to preserve legs for upcoming matchups.
Bench Scoring and Efficiency Metrics
Points per minute from bench units rise from 0.42 in the opening quarter to 0.51 in the second quarter, then stabilize near 0.48 in the third before reaching 0.53 in the fourth. Efficiency ratings follow a similar arc, with true shooting percentages climbing 3.8 points from first to fourth quarter for players who enter after the sixth minute of each period. These changes appear across 28 teams when researchers isolate games without overtime, providing a consistent baseline for statistical models.
Position-Specific Trends
Guard-heavy benches post larger gains in assists during the fourth quarter, while frontcourt reserves contribute more rebounding volume in the second quarter when starters sit. Wing players who rotate in during the third quarter record the smallest efficiency lift, averaging only 0.9 additional points per 10 minutes compared with their first-quarter output. One study compiled by sports analytics departments at North American universities isolated these position splits across 420 regular-season games from October 2025 through March 2026, highlighting how rotation timing interacts with player roles.
Application to Multi-Team Wager Layers
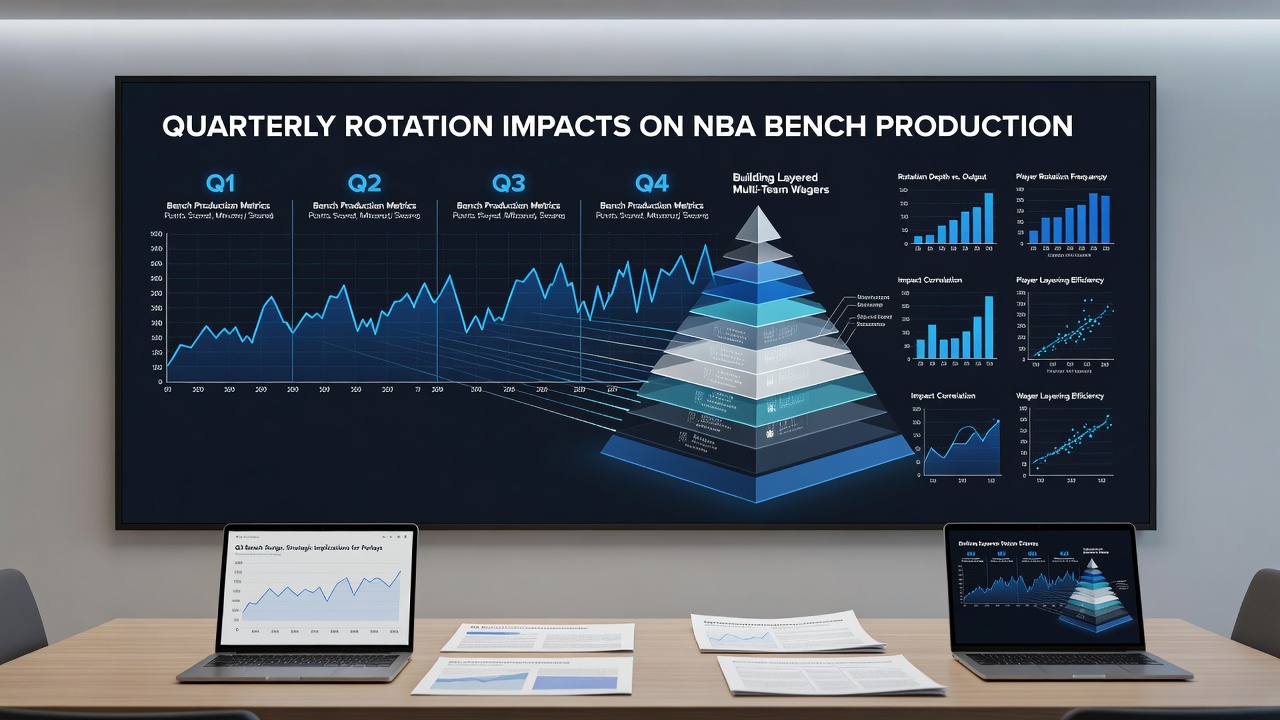
Betting operators and independent analysts track these quarterly splits when constructing layered wagers that combine multiple team totals or player props. A model built around second-quarter bench points, for example, can be paired with fourth-quarter rebound projections from a different matchup, creating a structure that accounts for staggered rotation windows across several games on the same slate. Figures released by the National Basketball Players Association in collaboration with league statisticians confirm that such data sets now appear in public reports distributed to media outlets each week.
August 2026 training-camp schedules already incorporate these historical rotation trends, with coaching staffs testing lineups that maximize bench efficiency in specific quarters. Teams preparing for the upcoming season review film from the prior campaign to adjust substitution patterns before the October tip-off, and the resulting adjustments feed directly into updated statistical databases used for wager layering.
Conference and Schedule Variations
Back-to-back sets produce the largest deviations, with bench scoring rising an additional 4.2 points per game in the fourth quarter compared with teams playing after a rest day. Home teams show a smaller but consistent increase in second-quarter bench minutes, averaging 0.7 minutes more than road squads. These schedule-driven differences appear in data compiled by multiple conference offices and remain stable when researchers control for opponent strength and travel distance.
Conclusion
Quarterly bench production patterns supply measurable inputs for models that combine outcomes across several NBA contests. Rotation timing, position-specific efficiency, and schedule context each contribute distinct variables that analysts incorporate when building layered multi-team structures, with fresh data arriving each week of the regular season.