Rebound Patterns in Conference Basketball Seasons Shaping Accumulator Decisions
Devon Vogel · Jun 28, 2026

Rebound Patterns in Conference Basketball Seasons Shaping Accumulator Decisions
Conference play in college basketball brings distinct rebound patterns that differ from non-conference matchups, and analysts track these trends to build accumulator selections with multiple legs across games. Teams adjust their defensive schemes and offensive positioning once league competition begins, which often leads to measurable shifts in rebound rates and second-chance opportunities. Observers note that offensive rebound percentages rise in certain conferences because physical play intensifies inside the paint, while defensive rebounding becomes more consistent for squads with experienced frontcourts.
Data from recent seasons shows that teams in the Big Ten and Big 12 collect offensive rebounds at rates 4 to 7 percent higher during conference games compared with earlier non-league contests. This increase stems from tighter officiating on perimeter fouls that forces more shots to miss near the rim, creating extra possessions. Accumulator builders incorporate these patterns by selecting teams that rank in the top quartile for offensive rebound margin when those squads face conference opponents with weaker interior defense.
Tracking Rebound Metrics Across Major Conferences
Researchers at the NCAA compile detailed box score data that highlights how rebounding efficiency changes as teams enter conference schedules. In the ACC, for instance, defensive rebound percentages stabilize around 72 percent once league play starts, whereas earlier games often fluctuate more widely due to varying opponent styles. Those who study these figures often pair high defensive rebound teams with squads that generate volume three-point attempts, because missed long-range shots produce longer rebounds that skilled big men can secure at higher rates.
Conference schedules also compress travel and rest patterns, which influences rebounding endurance over the course of a weekend. Teams that play back-to-back games on Friday and Saturday sometimes see their second-half offensive rebound numbers drop by two to three percentage points, a trend documented in season-long tracking reports. Smart accumulator constructions account for this fatigue factor by avoiding legs that rely on rebound dominance from squads with short rest.
Second-Chance Points and Accumulator Construction
Second-chance points derived from offensive rebounds frequently determine game margins in conference matchups, and betting markets adjust totals accordingly. Historical figures reveal that games featuring two top-50 offensive rebounding teams produce an average of 14.8 second-chance points per contest, compared with 9.2 points in games where both teams rank outside the top 100. Accumulators that include over totals on second-chance points gain an edge when the matchup profile aligns with these established conference trends.
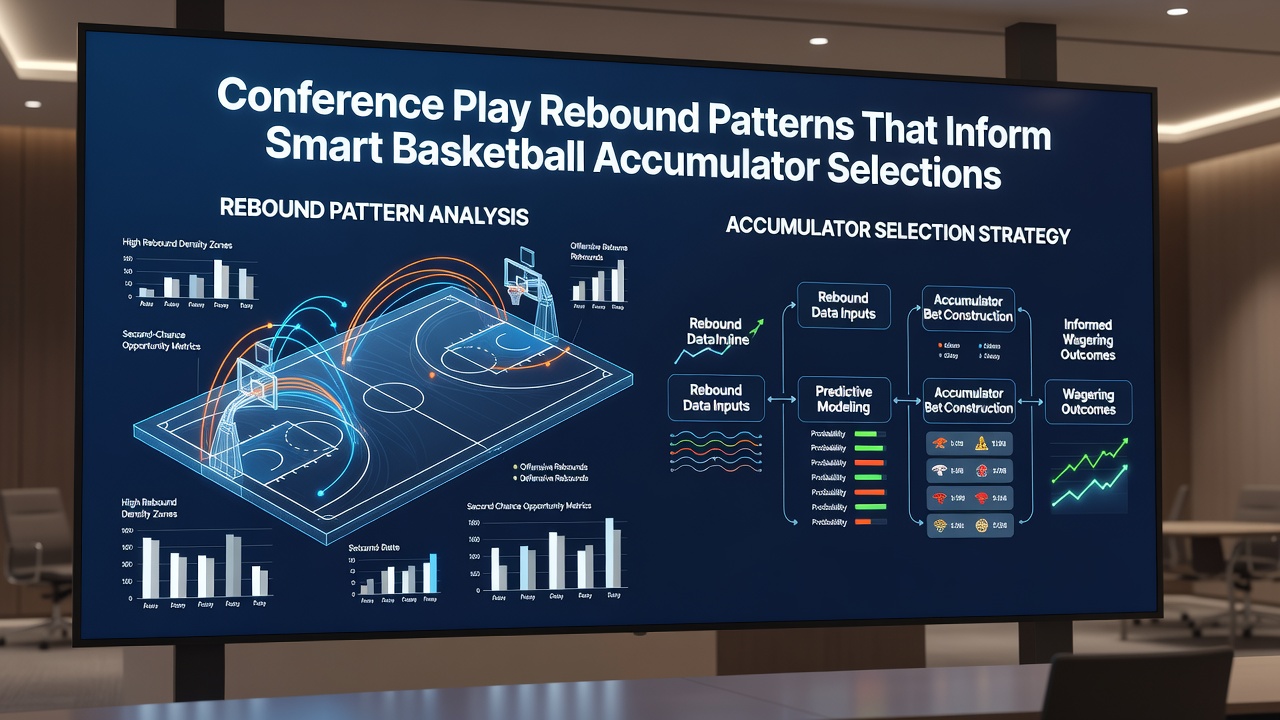
Coaches adjust lineups mid-season to emphasize rebounding specialists once conference play begins, and these changes appear in advanced metrics within two or three games. One study from the University of Michigan's sports analytics group tracked lineup changes across 68 Division I programs and found that inserting a dedicated rebounder improved team offensive rebound percentage by 5.1 points on average during league contests. Accumulator selectors monitor starting lineup announcements and injury reports to capture these adjustments before odds fully reflect the new personnel impact.
Conference-Specific Tendencies in June 2026 Schedules
As the 2026 season moves into June conference tournaments, rebound patterns from regular-season league play carry forward into postseason selection. The Big East has shown the highest variance in offensive rebound rates during its conference slate, with several teams swinging between 28 and 41 percent depending on opponent pace. This variability creates opportunities for accumulators that combine player props on rebound totals with team totals, because individual frontcourt players often exceed season averages when facing familiar conference defenses that allow more second shots.
European basketball federations publish parallel data for comparison, and observers note that rebounding margins in domestic leagues follow similar conference-driven spikes once teams enter divisional play. Those constructing cross-league accumulators sometimes blend NCAA conference trends with EuroLeague second-chance data to diversify risk across multiple basketball markets.
Advanced tracking systems now log contested rebound rates, which provide additional context beyond traditional box scores. Teams that win more than 35 percent of contested rebounds during conference games maintain higher win percentages over the final month of the regular season, according to reports from the National Association of Basketball Coaches. Accumulator strategies that favor these high-contest teams in underdog positions have produced consistent results across multiple seasons when the opposing frontcourt lacks size.
Integrating Rebound Data into Multi-Leg Selections
Successful accumulator construction requires layering rebound metrics with complementary statistics such as pace and three-point attempt volume. A team that ranks high in offensive rebounding but plays at a slow tempo may not generate enough total possessions to push second-chance points above betting thresholds. Analysts therefore cross-reference rebound percentages against tempo rankings published by organizations like Ken Pomeroy's efficiency database before finalizing legs.
Conference road games introduce additional variables because crowd noise and familiar rims can slightly depress visiting team rebounding efficiency. Data compiled over five seasons indicates that road teams in power-conference matchups secure 3.2 percent fewer offensive rebounds than they average in home conference games. This pattern prompts accumulator builders to adjust projected margins when selecting road underdogs that rely on second-chance production.
Player-level rebounding splits further refine selections. Bench players who enter during conference games often post elevated rebound rates because starters accumulate foul trouble more quickly in physical league contests. Tracking these substitution patterns allows for targeted player rebound props that complement broader team accumulator legs without overlapping correlated outcomes.
Conclusion
Conference play generates repeatable rebound patterns that inform accumulator construction when bettors combine team metrics, player tendencies, and schedule context into coherent multi-leg selections. The shift from non-conference to league competition alters rebound rates in measurable ways across major conferences, and those adjustments remain visible through June tournament play. Observers who monitor lineup changes, rest situations, and contested rebound data continue to refine models that capture these edges across both domestic and international basketball markets.