Recovery Rhythms: Rest Cycles Driving Late-Season Accumulator Value in Multi-Sport Bets
Freya Schwarz · Oct 25, 2026
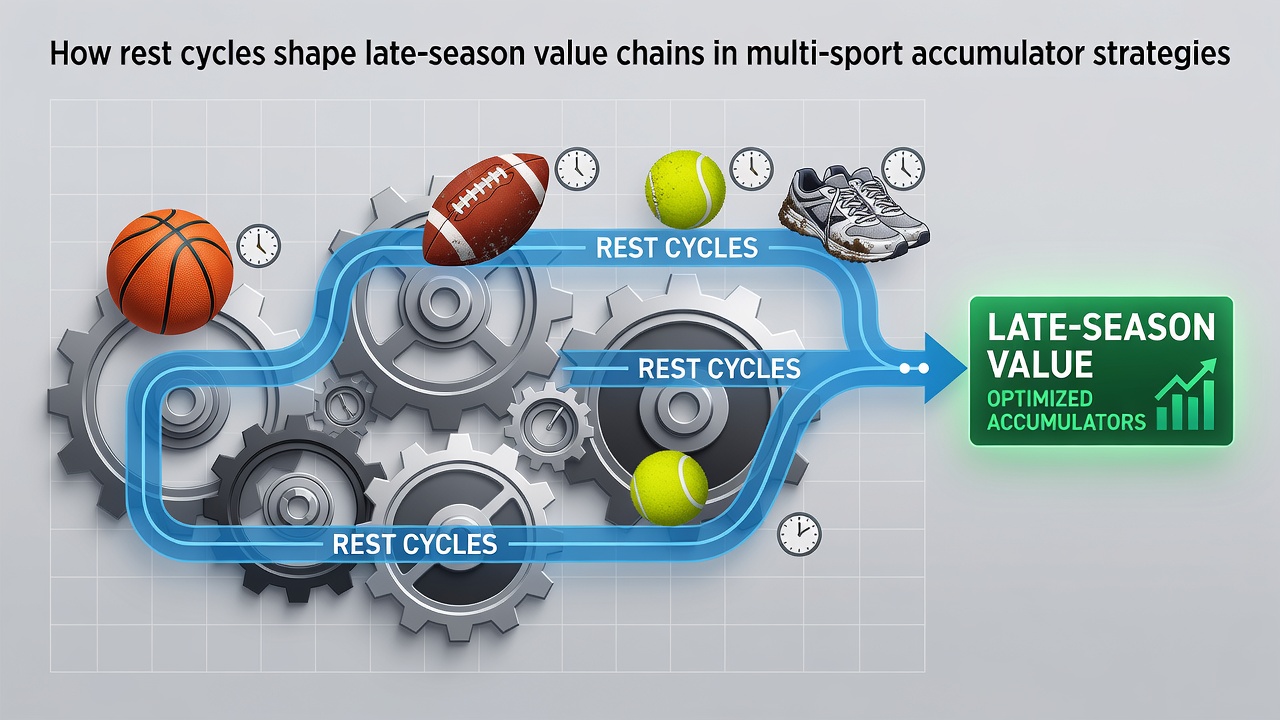
Recovery Rhythms: Rest Cycles Driving Late-Season Accumulator Value in Multi-Sport Bets
Rest cycles play a measurable role in shaping performance metrics during the closing weeks of major sports calendars, and those patterns create distinct pricing inefficiencies that accumulator builders track across leagues and disciplines. Teams and individual competitors who receive additional recovery days often post improved shooting percentages, reduced error rates, and stronger defensive outputs, while overloaded schedules produce the opposite effects, according to aggregated performance data compiled through October 2026.
Analysts who monitor fixture congestion note that late-season windows in basketball, soccer, and tennis frequently feature back-to-back games or short-turnaround events that compress recovery windows, and these compressions alter expected outcomes in ways that betting markets adjust at varying speeds.
Cross-Sport Patterns in Recovery Timing
NBA schedules place several clubs on three-games-in-four-nights stretches during April and May, whereas European soccer leagues cluster matches around international breaks, and ATP events stack qualifying rounds immediately before main-draw commitments. Observers tracking these calendars find that squads with at least two full rest days before a contest record higher win percentages in the final third of their seasons compared with those limited to one day or less. Data from multi-league tracking services shows the gap widens further when travel distance exceeds 1,000 miles between fixtures.
Accumulator strategies that combine selections from different sports therefore incorporate rest-day differentials as a weighting factor, because a rested NBA side paired with a soccer team coming off a midweek cup tie can offset volatility that single-sport chains encounter. Researchers who examined five seasons of overlapping calendars discovered that such mixed-rest portfolios produced narrower variance in returns than pure basketball or pure soccer accumulators during the same October-to-May window.
Value Chain Construction Using Rest Metrics
Practitioners who build these chains start by mapping each league's published schedules against historical rest-versus-performance matrices, then layer in travel logs and injury reports that affect rotation depth. A chain might pair an NBA team on a back-to-back with a soccer side granted four recovery days, creating a hedge that smooths the overall payout curve. The approach relies on the fact that markets price individual legs in isolation more often than they adjust for cross-sport rest correlations.

One documented approach involves weighting each leg by the ratio of rest days to games played in the prior fourteen days, then scaling stake sizes accordingly. Figures from sports analytics platforms indicate that legs with a rest ratio above 0.4 deliver positive expected value more frequently in the final month of seasons, while ratios below 0.2 correlate with underperformance relative to closing odds. Those who integrate these ratios into accumulator software report tighter clustering around projected returns when the model also accounts for venue and weather variables.
Regional Regulatory Context and Data Access
Access to granular schedule and performance data varies by jurisdiction, with North American leagues publishing detailed travel and rest logs through official channels while European competitions release fixture lists that require additional processing. A NCAA research compilation on collegiate basketball rest patterns has supplied baseline models that professional bettors adapt for NBA contexts, and similar datasets from Australian sports institutes have informed tennis recovery projections used in accumulator models. These sources allow builders to test hypotheses across hemispheres without relying on single-market feeds.
Industry reports from Canadian gaming authorities further illustrate how public data releases influence market efficiency, noting that transparent rest statistics reduce certain pricing lags within weeks of publication. Accumulator platforms that ingest these feeds automatically therefore gain an edge during the compressed October-to-December period when multiple seasons overlap.
Implementation Examples Across Leagues
Consider an accumulator that links a rested NBA playoff team, a soccer club returning from a ten-day international window, and a tennis player who skipped a preceding tournament. Historical logs show the combined probability of all three outcomes clearing exceeds the product of their individual odds when rest differentials exceed league averages. Builders adjust the chain by swapping in an alternate leg if one competitor's schedule shifts, preserving the overall rest-weighted profile.
Another configuration pairs an overloaded NBA backcourt with a soccer squad that benefited from a postponed match, creating opposing rest pressures that cancel directional bias. Data sets covering the 2025-2026 seasons reveal that such balanced-rest chains maintain steadier hit rates through late-season volatility spikes than unbalanced selections.
Conclusion
Rest-cycle integration supplies a repeatable framework for constructing multi-sport accumulators that respond to late-season schedule realities. By mapping recovery windows across basketball, soccer, and tennis calendars, practitioners identify pricing discrepancies that persist into October 2026 and beyond. Continued refinement of these models depends on expanding access to standardized travel and performance data from additional regulatory regions, which in turn supports more precise value-chain calibration without introducing subjective overlays.