Road Trip Usage Shifts Reveal Hidden Basketball Prop Value
Leon Franke · Jul 30, 2026
Road Trip Usage Shifts Reveal Hidden Basketball Prop Value
Usage rate measures the percentage of team possessions a player finishes while on the court, and analysts track this metric closely when road trips stretch across multiple cities. Data compiled by the NBA shows that players often see their usage climb or drop by 4 to 8 points during extended away stretches because travel and schedule density alter rotation patterns. Those shifts create measurable edges for player prop markets that price action has not yet absorbed.
How Travel Schedules Alter Playing Time
Teams play three games in four nights on many western conference swings, and minutes distributions change as coaches manage rest. A guard who logs 32 minutes at home might receive 36 on the road when backcourt depth thins because of minor injuries or foul trouble. Researchers at the MIT Sloan Sports Analytics Conference documented that usage rate rises in these scenarios because the player takes more shots and handles the ball during transition sets. Prop markets that rely on season-long averages miss these short-term adjustments.
Matching Usage Data to Prop Markets
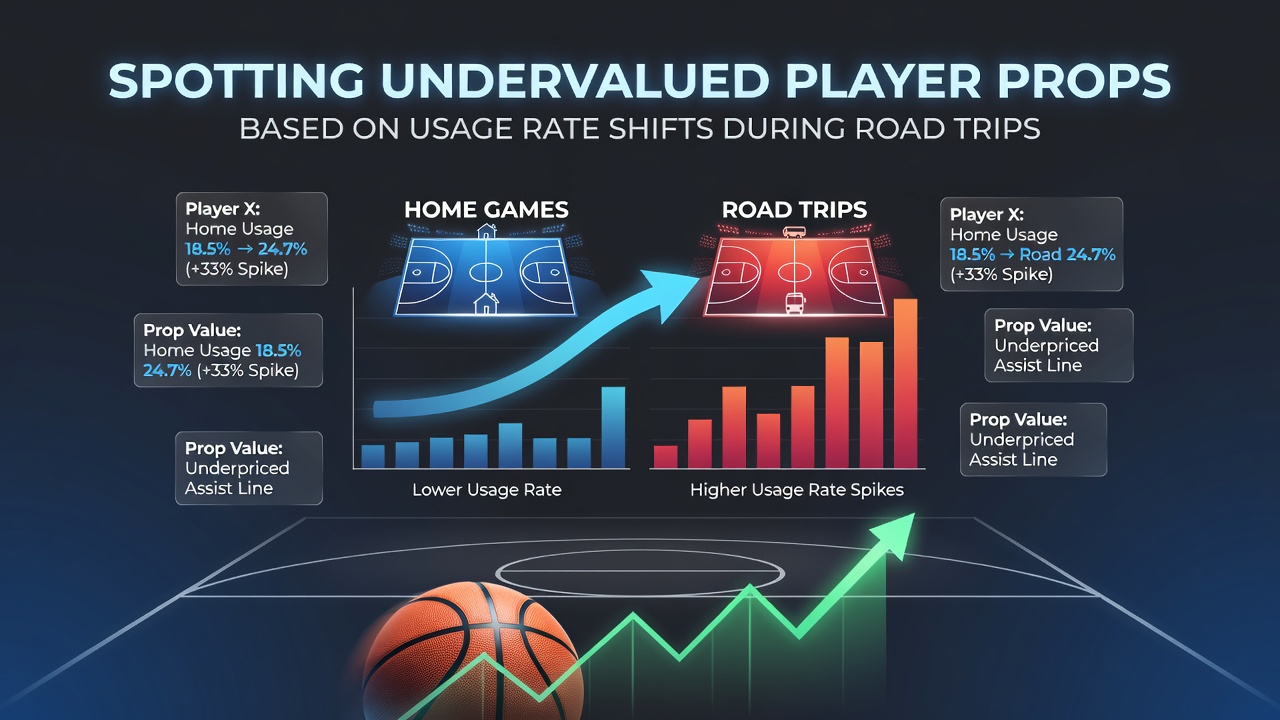
Points, rebounds, and assists props move when a player's share of possessions expands. A forward whose usage jumps from 18 percent to 24 percent during a five-game road trip typically sees rebound attempts increase by 1.8 per game, according to tracking data released by Second Spectrum. Bettors who cross-reference daily usage reports with upcoming opponent defensive ratings identify lines that sit below the adjusted projection. The same process applies to assists when a primary creator sits out a back-to-back and a secondary ball-handler absorbs extra touches.
League-wide figures reveal that road usage spikes appear most often among bench players who enter earlier in the second quarter. Those minutes carry higher offensive responsibility because starters receive shorter shifts to preserve energy for later games on the trip. Analysts who monitor real-time box score feeds notice the pattern within the first two road contests and adjust projections before sportsbooks update their models.
Case Examples From Recent Seasons
One western conference team completed a six-game road trip in January 2026 where its backup point guard posted usage rates above 22 percent in four of the six games. The player's assist prop opened at 4.5 on most books yet the adjusted expectation, based on increased ball-handling share, sat closer to 6.2. Similar patterns surfaced during a March 2026 eastern conference swing when a reserve forward's rebounding rate climbed after the starting center dealt with a minor ankle issue. Prop lines adjusted only after the third game, leaving an opening for bettors who followed the usage trend from the outset.
Tools and Data Sources for Tracking
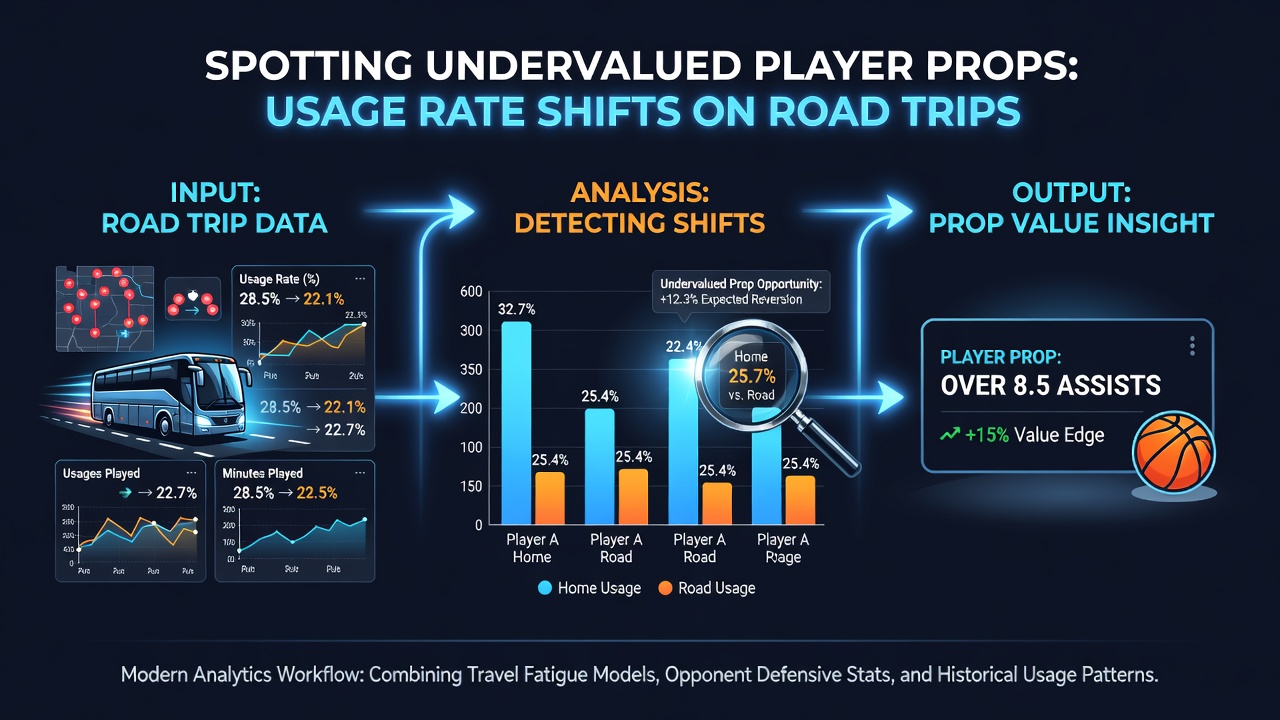
Public sites publish daily usage rate tables that update within hours of game completion. Observers combine those numbers with travel distance logs and rest days between games to build simple regression models. A study published in the Journal of Quantitative Analysis in Sports found that including cumulative road miles improved usage forecasts by 11 percent compared with models that used only home-road splits. Bettors who apply similar filters to player prop databases reduce variance in their projections.
Advanced tracking systems now separate usage into half-court sets versus transition opportunities, and road games produce more transition possessions because defensive schemes tighten on familiar home courts. The extra transition share lifts usage for wings who run the floor, creating separate edges in points and assists props that traditional averages overlook.
Adjusting for Opponent and Venue Factors
Usage shifts do not occur in isolation. Strong defensive teams force more turnovers and contested shots, which can suppress a road player's efficiency even when possession share rises. Data from the 2025-26 season indicates that usage increases on the road produce larger prop edges against bottom-third defenses, while top defenses compress those edges. Cross-referencing opponent defensive rating rankings with usage reports adds another layer of precision before placing a wager.
Building a Repeatable Process
Analysts who follow this approach maintain spreadsheets that flag players whose road usage deviates more than one standard deviation from their season mark. They then compare the adjusted projection against current prop lines across multiple sportsbooks. The process repeats each week because schedule density and injury reports change rapidly. July 2026 offseason roster moves will alter baseline usage rates for several teams, yet the underlying travel-related patterns remain consistent across seasons.
Conclusion
Usage rate shifts during road trips supply objective signals that translate directly into player prop adjustments. Systematic tracking of these changes, combined with opponent context and schedule data, allows identification of lines that lag behind updated expectations. As more detailed tracking information becomes available each season, the method continues to rely on verifiable possession metrics rather than narrative assumptions.