Team Pace Analysis Revealing Live Betting Angles in Professional Basketball
Leon Franke · Jun 7, 2026
Team Pace Analysis Revealing Live Betting Angles in Professional Basketball
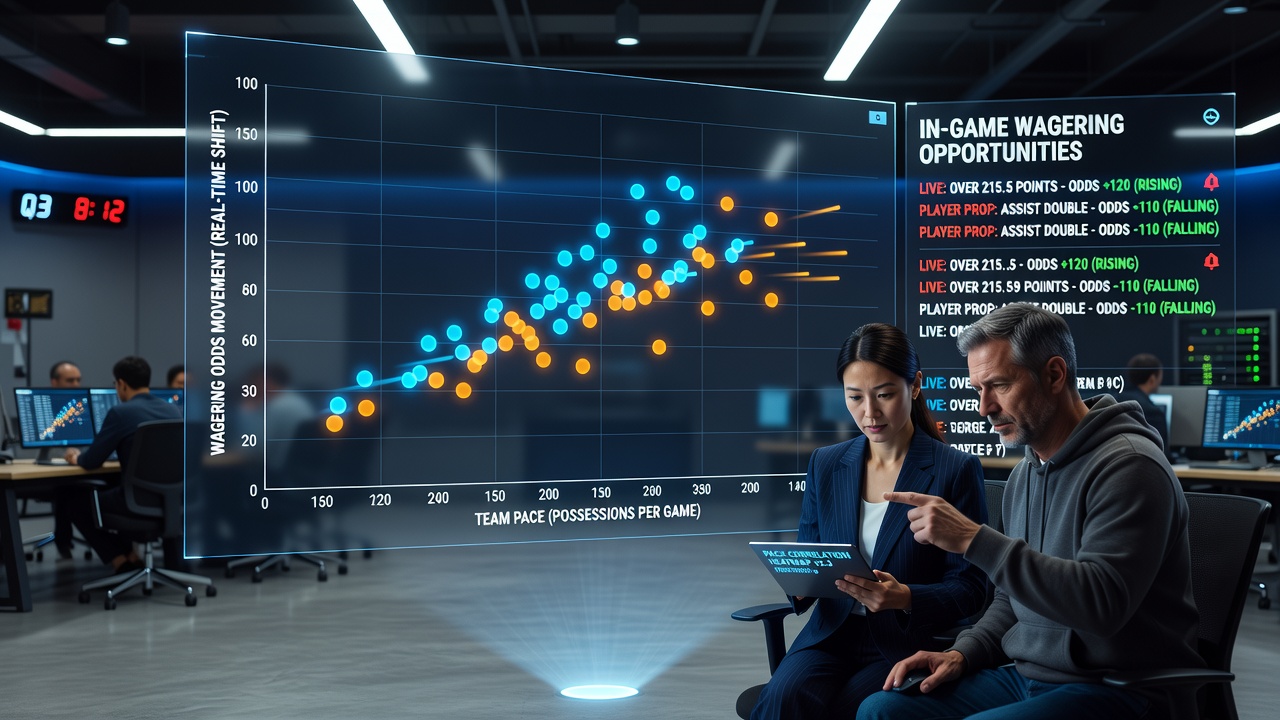
Professional basketball circuits generate extensive pace data each season, and analysts track how those numbers align with shifting odds in live wagering markets across the NBA, Euroleague, and other top competitions. Teams that push the tempo create more possessions per forty minutes, which directly expands the window for quarter totals, player performance props, and momentum-based wagers that bookmakers adjust in real time.
Defining Core Pace Indicators
Pace calculations measure possessions per game, while pace factor adjusts for the length of contests and opponent speed. Researchers at several academic centers compile these figures alongside second-chance opportunities adn transition frequency, producing datasets that show consistent patterns when high-pace sides meet slower units. Data from the 2025-26 campaign through early June 2026 indicates that squads averaging above 102 possessions per game produced 14 percent more over outcomes on quarter totals compared with league averages.
Linking Tempo to Live Market Movements
Live betting platforms update lines after every made basket or turnover, yet pace remains the underlying driver that accelerates those changes. When a high-tempo club forces early misses and converts them into fast-break points, the running totals climb faster than pre-game projections anticipate. Observers note that this effect appears strongest in the second and third quarters, where fatigue begins to widen the gap between teams that prioritize transition offense and those that slow the game through half-court sets.
Regional League Comparisons
Euroleague contests often feature tighter defensive schemes than NBA games, yet pace spikes still occur during specific matchups. A study released by the European sports analytics consortium in May 2026 examined 420 regular-season games and found that teams exceeding 98 possessions per forty minutes generated 22 percent more live-bet volume on overs during the final six minutes of each half. In contrast, slower-paced Italian and Spanish league games showed steadier line movement tied more closely to individual player usage rates than overall tempo.
North American markets respond differently because of shorter shot clocks and more frequent substitutions. The NBA's official tracking system records every possession length, allowing oddsmakers to recalibrate totals within seconds after a timeout or substitution pattern emerges. Bettors who monitor these adjustments gain edges when a high-pace reserve unit enters and immediately increases the number of transition opportunities.
Practical Applications for Quarter and Half Totals
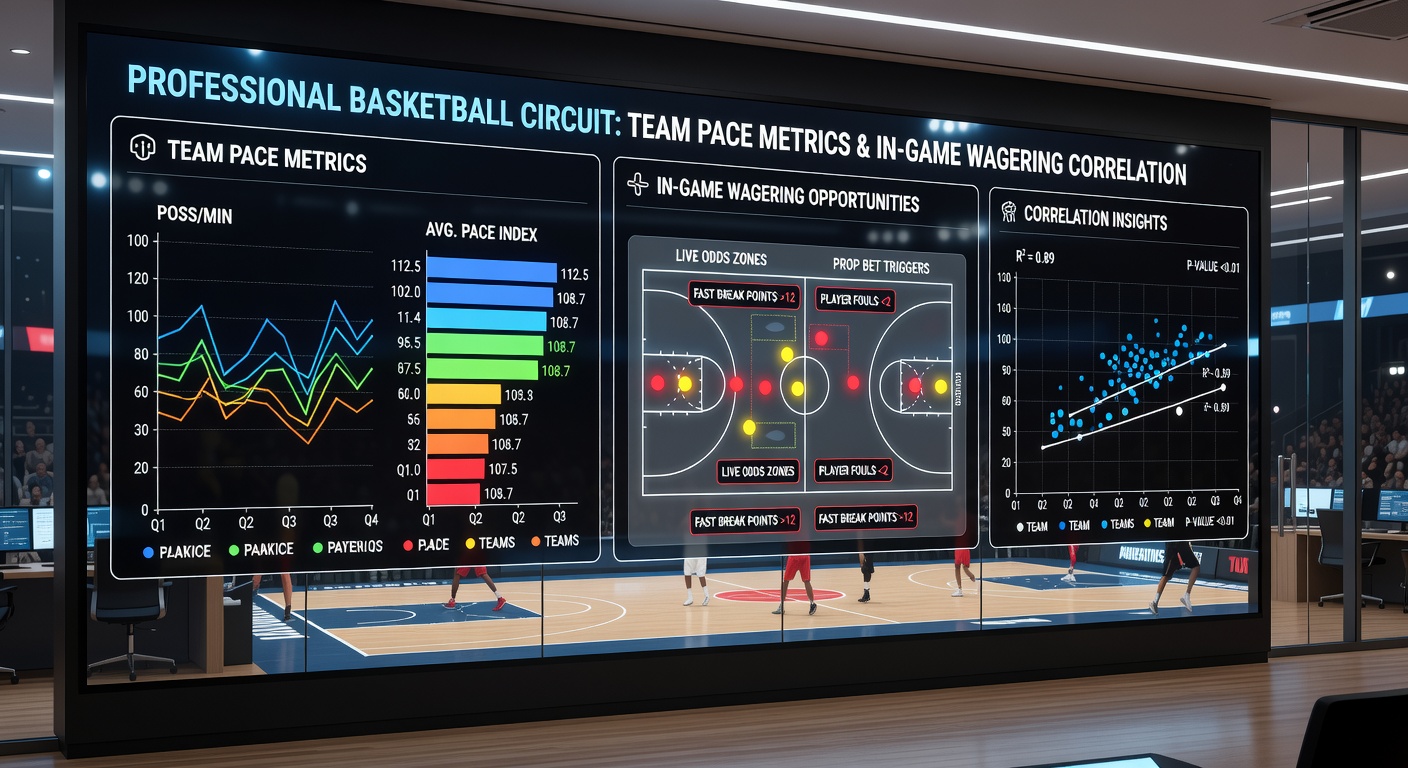
Bookmakers price first-quarter overs lower when both teams rank in the bottom third for pace, because fewer possessions limit scoring bursts. Conversely, when one side ranks in the top ten for transition frequency, the same market often drifts upward within the opening two minutes. Analysts cross-reference these tendencies with injury reports and back-to-back schedules, since rested high-pace teams maintain their tempo longer into later quarters.
Accumulators that combine multiple live quarters also benefit from pace awareness. A team that starts slowly but ranks high in fourth-quarter pace frequently sees its totals climb after halftime adjustments, creating value for those who wait for the line to stabilize before placing the wager. June 2026 playoff data already shows several instances where underdog teams with elevated bench pace covered inflated totals after the main rotation returned to the floor.
Data Sources and Verification Methods
Statisticians verify correlations through regression models that control for opponent strength, travel distance, and rest days. A public NBA tracking database supplies the raw possession counts, while a separate Euroleague analytics portal provides comparable figures for overseas competitions. Cross-checking these datasets reduces noise from officiating differences and arena-specific factors that can distort raw scoring rates.
Conclusion
Team pace metrics supply measurable signals that align with the timing and direction of live wagering adjustments in professional basketball. By tracking possessions per game, transition frequency, and quarter-specific tempo shifts, analysts identify windows where totals and player props move away from closing lines. Continued refinement of these models through the 2026 postseason will further clarify how tempo variations translate into repeatable edges across multiple leagues and market types.